2026 Spending Benchmarks for Private B2B SaaS Companies


SaaS Capital conducts a survey of private, B2B SaaS company metrics in the first quarter of each year. Our 15th annual survey, completed in March 2026, saw more than 1,000 SaaS companies respond. This post summarizes benchmarking data around the topic of spending. Survey takers were asked, “What percentage of revenue is currently spent on the following? (Percentages should total less than 100 if your company is profitable, and more than 100 if it is not.)”
How Much Do Private SaaS Companies Spend?
The total median spend across all departments is 96% of Annual Recurring Revenue (ARR) for bootstrapped companies while equity-backed are spending 101% of ARR.
What Percent of Private SaaS Companies are Profitable?
Based on the total median spend, 83% of bootstrapped companies are operating within two percentage points of breakeven or are profitable while only 52% of equity-backed are breakeven or profitable. Or said another way, 17% of bootstrapped companies are operating at a loss while 48% of equity-backed are operating at a loss.
Private SaaS Company Spending by Department
How much do SaaS companies spend on sales?
- The median percent of annual recurring revenue spent on selling costs is 15%, up from 13% from the previous year.
How much do SaaS companies spend on marketing?
- The median percent of annual recurring revenue spent on marketing is 8%, unchanged from the previous year.
How much do SaaS companies spend on customer support and customer success?
- The median percent of annual recurring revenue spent on customer support and customer success is 9%, up from 8% the previous year.
How much do SaaS companies spend on hosting?
- The median percent of annual recurring revenue spent on hosting is 5%, unchanged from the previous year.
How much do SaaS companies spend on DevOps?
- The median percent of annual recurring revenue spent on DevOps is 4%, unchanged from the previous year.
How much do SaaS companies spend on Pro Services CoGS?
- The median percent of annual recurring revenue spent on Pro Services CoGS is 5%, unchanged from the previous year.
How much do SaaS companies spend on Other CoGS?
- The median percent of annual recurring revenue spent on Other CoGS is 3%, up from 2% the previous year.
How much do SaaS companies spend on research and development?
- The median percent of annual recurring revenue spent on research and development is 22%, unchanged from the previous year.
How much do SaaS companies spend on general and administrative costs?
- The median percent of annual recurring revenue spent on general and administrative costs is 15%, up from 14% the previous year.
SaaS Spending by Company Funding
As discussed in our Private SaaS Company Growth Rate Benchmarks, equity-backed funding is generally correlated with growth. It may not be a causal relationship, but there has been a historical relationship. On median, bootstrapped companies report growing at 20% per year, whereas companies that have raised venture capital are growing at 25% annually. The chart below shows median spend benchmarks, as a percent of ARR, for equity-backed companies and bootstrapped companies.
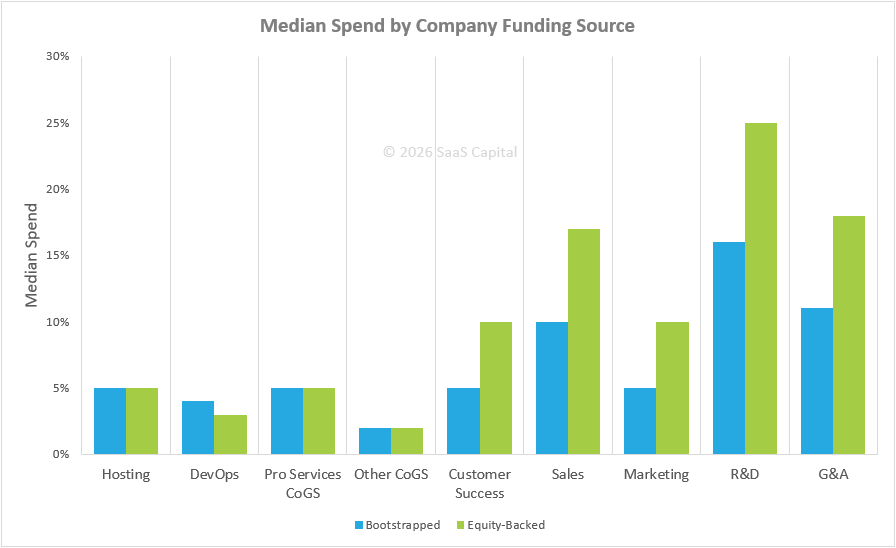
As noted above, the majority of bootstrapped companies are spending less (and are profitable), while approximately half of equity-backed companies are operating at a loss to support a goal such as growth. The most dramatic differences include equity-backed companies spending 70% more on sales, 64% more on general and administrative costs, 100% more on marketing, 56% more on R&D, and 100% more on customer success.
The increased spending by equity-backed companies on sales, marketing, and R&D is somewhat expected. The difference in general and administrative costs is noteworthy. One possible explanation for why equity-backed companies spend more is the need for a robust administrative and finance team to support reporting requirements to investors, including regular board meetings and audits.
Drilling down on growth and funding sources, we compare companies growing above their respective median growth vs. those growing below their respective median.
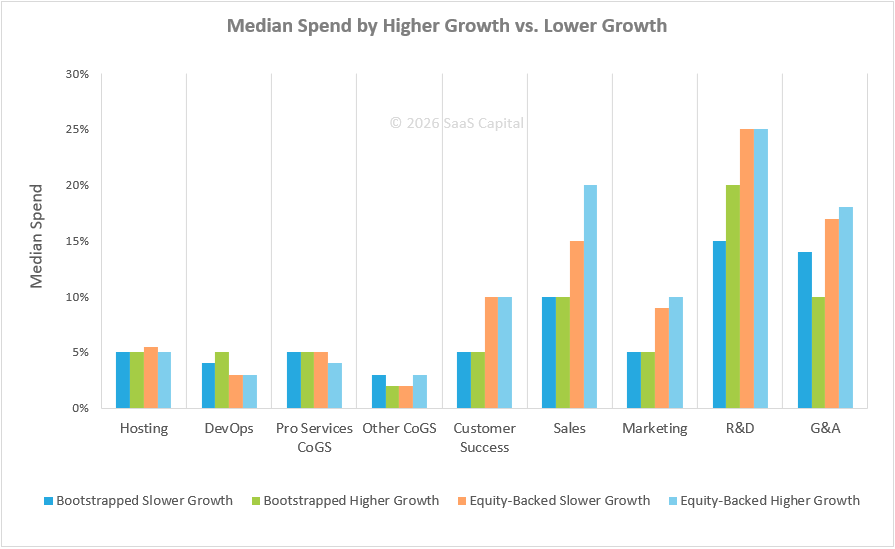
The difference between higher-growth bootstrapped companies and lower-growth bootstrapped companies is most noticeable in R&D and G&A, with higher-growth companies spending more on R&D and less on G&A than slower growth bootstrapped companies. Meanwhile, higher-growth companies are also spending more on Sales and Marketing.
SaaS Spending by ARR Levels
For benchmarking purposes, another metric by which to compare your business to your peers is revenue scale.
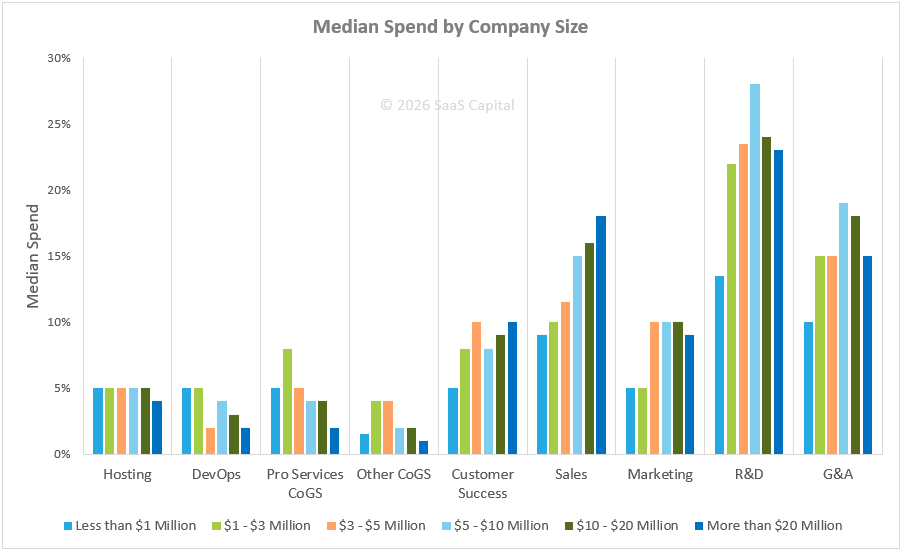
The chart above breaks spending levels down by company size. For example, a typical B2B company with $3 Million to $5 Million in ARR spends the following as a median percent of ARR:
- 5% on Hosting Costs
- 3% on DevOps Costs
- 5% on Pro Services CoGS
- 3.5% on Other CoGS
- 10% on Customer Support/Success
- 12% on Selling Costs
- 8% on Marketing Costs
- 24% on Research and Development
- 15% on General and Administrative
The charts above plus additional data are available in the summary report below.
![]()